Objective
20-50 million people are injured in auto accidents globally with an accrued cost of $518 billion. Since the first insurance claim in 1897, car insurance companies have worked to cover the expenses incurred from these incidents - from property damage, medical expenses, lost wages, to legal fees. With these enormous expenses insurance companies are obligated to take any opportunity to optimize their solvency and minimize losses. A large part of this is appropriately pricing policies and coverage, meaning, to not undercharge for drivers that cause catastrophic, costly incidents and not overcharge for safe customers that might never make a claim and could easily switch providers.
The focus of this project was to develop a binary classification model to better predict whether risk can be associated with a car based on its attributes. This was an effort to aid in the risk assessment process and offer more individualized rates car insurance rates, promoting customer retention and company solvency.
The focus of this project was to develop a binary classification model to better predict whether risk can be associated with a car based on its attributes. This was an effort to aid in the risk assessment process and offer more individualized rates car insurance rates, promoting customer retention and company solvency.
Methodology
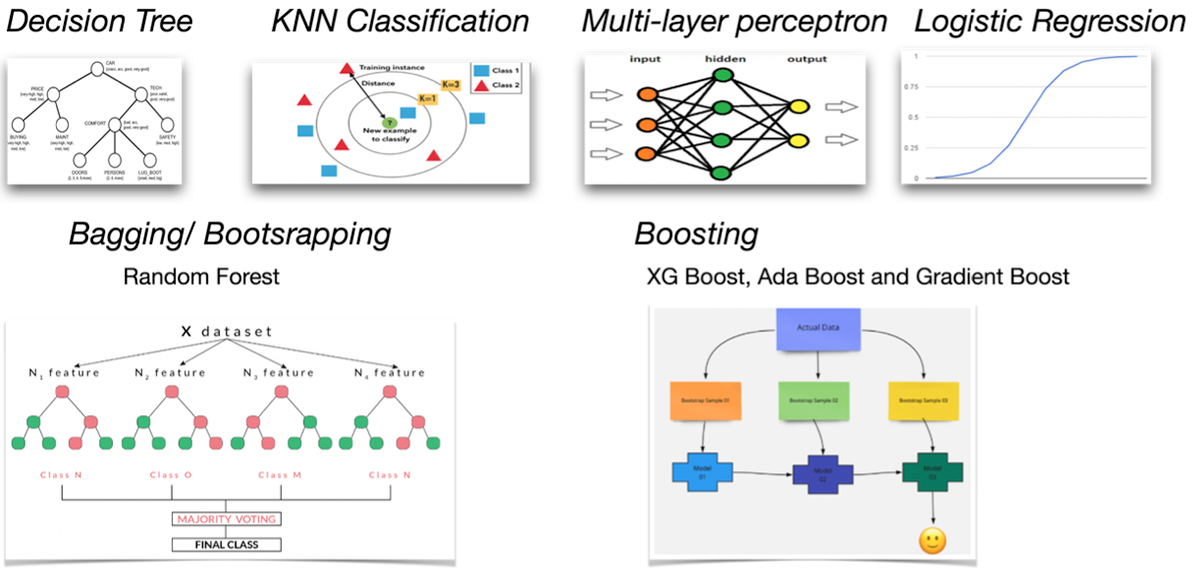
Feature importances were first determined by aggregating importance scores from five different models for each of the columns. This provided us with a definitive list of feature importances to guide our model definitions. The following eight predictive models were created for binary classification: Decision Tree, Random Forest, AdaBoost, GradientBoost, XGBoost, k-Nearest Neighbors, Logistic Regression, and Multilayer Perceptron (neural network). Where applicable, hyperparameter tuning was realized using GridSearchCV and RandomSearchCV.
The original dataset contained 205 records with 26 features (15 continuous, 1 integer, and 10 nominal), including the integer outcome (risk) ranging from -3 to +3. 7 columns had missing values present (normalized-losses, num-of-doors, bore, stroke, horsepower, peak-rpm, and price). 'normalize-losses' has 44 missing values and the remaining columns each have 2 missing values. 44 records represents more than 1/5 of our data so these records will be replaced with the median rather than omitted from analysis.
Conclusions
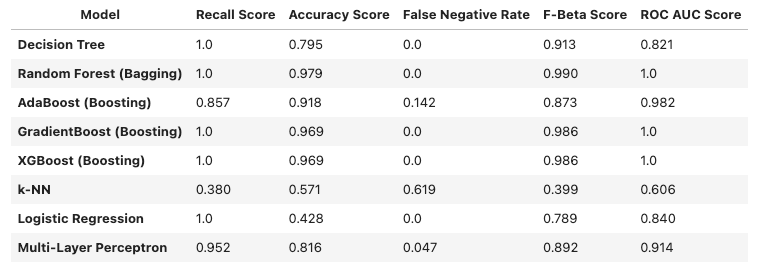
In the context of this analysis, focus is on recall to avoid the classification of false negatives (mistakenly identifying a risk driver as safe) because this would result in the most loss from the insurance company. Based on the metrics shared in the table below, Random Forest achieves the highest results for f-beta and recall. Additionally, the ROC AUC score indicates them model is fit well against the data, so we can be confident these predictions are sound.
Insurance companies are motivated to offer competitive, individualized rates - better risk prediction will help insurance companies achieve this. After selecting RandomForest as the binary classification model of choice, we understand this can be used by insurance companies to better identify which car models can be assumed as risky.
Although this only contributes to a portion of the overall risk assessment from the car insurance company, we've seen that these processes are already automated to consider additional risk factors and our model helps optimize this process for the car attributes specifically.
With our model, insurance companies can better predict whether the car model is associated with risk, therefore increasing the efficacy of their overall ratemaking process. This allows them to offer customers more individualized insurance rates which promotes customer retention and company solvency.
Skills
- Risk assessment
- Predictive modeling
- Hyperparamter tuning
- Comparing machine learning approaches
- Predictive modeling
- Hyperparamter tuning
- Comparing machine learning approaches